







Employee attendance is about much more than whether someone showed up for work.
For HR teams, attendance data can reveal recurring absences, late arrivals, understaffing, excessive overtime, scheduling problems, timekeeping errors, and differences between the hours employees are expected to work and the hours they actually work.
The challenge is knowing which numbers actually matter.
Tracking every clock-in without turning the data into useful metrics gives managers plenty of information but very little insight. A better approach is to monitor a focused set of employee attendance metrics that help HR understand attendance patterns, investigate exceptions, improve scheduling, and maintain more accurate working-time records.

For context, the U.S. Bureau of Labor Statistics reported a 3.2% absence rate and a 1.7% lost worktime rate among full-time wage and salary workers in its 2025 annual table. BLS defines these measures carefully and excludes absences caused by vacation, personal days, holidays, and some other reasons, which demonstrates why companies should separate approved leave from attendance problems when analyzing their own data.
This guide explains 10 employee attendance metrics HR should track, how to calculate them, what each metric can tell you, and how attendance and time tracking software such as Day Off can make the data easier to review.
What Are Employee Attendance Metrics?
Employee attendance metrics are measurable indicators that show how employees’ actual attendance compares with their expected work schedules.
They can measure factors such as:
- Attendance
- Absence
- Late arrivals
- Early departures
- No-shows
- Scheduled versus actual hours
- Overtime
- Missing time records
- Frequency of absence
- Unplanned time away from work
Some metrics are calculated as percentages, while others are better measured as hours, minutes, incidents, or averages.
The objective is not simply to collect more employee data. Attendance metrics should help HR answer practical questions such as:
- Are employees regularly arriving late?
- Which teams have the highest absence rates?
- Are employees working more hours than scheduled?
- Are certain shifts experiencing frequent no-shows?
- Is approved PTO being incorrectly classified as absence?
- Are managers spending too much time correcting missing punches?
- Is a department consistently understaffed?
- Are actual working hours matching scheduled hours?
- Is overtime concentrated among a few employees?
- Are attendance patterns changing over time?
A useful attendance dashboard turns daily records into answers to these questions.
Why Employee Attendance Metrics Matter
Attendance directly affects workforce availability.
If several employees are unexpectedly absent, managers may need to reorganize shifts, redistribute work, approve overtime, find replacements, or delay certain tasks. If the same situation happens repeatedly, it may indicate a larger scheduling, staffing, workload, or attendance-management problem.
Accurate attendance records can also matter for payroll and working-time administration.
For covered nonexempt employees in the United States, the Fair Labor Standards Act requires employers to maintain accurate information including hours worked each day and total hours worked during each workweek. The U.S. Department of Labor does not require one specific timekeeping method, but records must be complete and accurate.
Attendance metrics therefore serve several purposes:
- Monitor workforce availability
- Identify repeated attendance exceptions
- Improve staffing decisions
- Support payroll preparation
- Detect scheduling problems
- Monitor overtime
- Improve timesheet accuracy
- Understand absence patterns
- Compare scheduled and actual working time
- Give managers measurable trends instead of individual anecdotes
However, HR should always interpret attendance metrics in context. Approved PTO, protected leave, company policies, local employment laws, disability accommodations, different working schedules, and legitimate emergencies may all affect an employee’s attendance record.
The metric should start the investigation, not automatically decide the outcome.
Employee Attendance Rate
The employee attendance rate measures how consistently employees attend the work they are expected to perform.
A basic formula is:
Attendance Rate = Attended Scheduled Workdays ÷ Expected Workdays × 100
You can also calculate it using shifts rather than days.
Example
Suppose an employee was expected to work 22 days during a month.
After excluding approved vacation days and company holidays, the employee was expected to attend 20 days and attended 19.
The calculation would be:
19 ÷ 20 × 100 = 95% attendance rate
This provides HR with a simple overall indicator of attendance.
Why Attendance Rate Matters
Tracking attendance rates over time can help identify:
- Employees or teams with changing attendance patterns
- Locations with unusually low attendance
- Seasonal attendance changes
- Scheduling difficulties
- Workforce availability trends
However, HR should define the metric carefully.
If an employee takes five days of approved vacation, those days generally should not automatically damage the person’s attendance KPI. Planned PTO and attendance exceptions should be classified separately.
This is particularly important because even external workforce statistics make distinctions between types of absence. For example, the BLS absence measure excludes vacation and personal days.
Employee Absence Rate
The employee absence rate measures how much scheduled working time is lost because employees are absent.
A common internal formula is:
Absence Rate = Absence Hours ÷ Scheduled Work Hours × 100
Companies using days instead of hours may calculate:
Absence Rate = Absent Workdays ÷ Scheduled Workdays × 100
Example
An employee was scheduled for 160 working hours during the month but had 8 hours of qualifying unplanned absence.
8 ÷ 160 × 100 = 5% absence rate
The employee’s absence rate for the month would be 5%.
Why HR Should Track Absence Rate
One absence is rarely enough to identify a meaningful workforce trend.
When absence rates are tracked across several months, however, HR can begin to see whether:
- Absence is increasing
- One department has unusually high absence
- Certain days have more absences
- A particular shift regularly has staffing problems
- Seasonal patterns exist
- Absence is concentrated among particular roles or locations
Be Consistent With the Formula
There is no reason to compare an internally calculated absence rate directly with an external benchmark unless both figures use the same definition.
For example, the BLS absence rate measures the proportion of full-time workers experiencing qualifying absences, while its separate lost worktime rate measures absent hours as a percentage of hours usually worked.
Your HR team should document exactly what your internal absence rate includes and excludes.
Absence Frequency
Two employees can have the same number of absent days but very different attendance patterns.
Consider these examples:
Employee A: One absence lasting five consecutive days
Employee B: Five separate one-day absences
Both employees recorded five absent days.
But the operational impact can be very different.
That is why HR should measure absence frequency in addition to the total amount of time absent.
A simple employee-level calculation is:
Absence Frequency = Number of Separate Absence Incidents During the Period
For team-level reporting, HR might calculate:
Absence Incidents per Employee = Total Absence Incidents ÷ Number of Employees
Example
A department with 25 employees records 15 separate unplanned absence incidents during a quarter.
15 ÷ 25 = 0.6 absence incidents per employee
HR can then compare the figure with previous quarters or other departments.
Why Frequency Matters
Frequency helps distinguish between:
- Long-term absence
- Repeated short-term absence
- Isolated emergencies
- Recurring attendance patterns
Do not use frequency alone to make disciplinary decisions.
Repeated absence may have legitimate explanations, and legal protections can apply depending on the employee, reason, jurisdiction, and circumstances.
Use the metric as an indicator requiring appropriate review.
Unplanned Absence Rate
Planned and unplanned absences affect workforce planning differently.
If an employee requests vacation three weeks in advance and a manager approves it, the team has an opportunity to prepare.
An unexpected absence immediately before a shift creates a different operational challenge.
For that reason, HR should consider tracking unplanned absence separately from approved PTO.
A useful formula is:
Unplanned Absence Rate = Unplanned Absence Hours ÷ Scheduled Work Hours × 100
Example
A team was scheduled to work 1,600 hours during the month.
Employees recorded 48 hours of unplanned absence.
48 ÷ 1,600 × 100 = 3%
The team’s unplanned absence rate is 3%.
Why This Metric Is Useful
Separating unplanned absence from PTO can help HR avoid interpreting normal leave usage as poor attendance.
It can also reveal whether managers regularly face unexpected staffing gaps.
Analyze the rate by:
- Department
- Team
- Location
- Shift
- Day of the week
- Month
- Job role
For example, if unplanned absence is consistently higher during overnight shifts, the issue may deserve investigation at the schedule or workforce-planning level rather than being treated only as an individual employee problem.
Lateness Rate
Occasional lateness happens.
Repeated late arrivals, however, can create operational problems for businesses that depend on shift coverage, customer service, production schedules, opening hours, or handovers between employees.
The lateness rate measures how frequently employees clock in after their scheduled start time.
A simple formula is:
Lateness Rate = Late Arrivals ÷ Scheduled Starts × 100
Example
An employee had 20 scheduled shifts and arrived late three times.
3 ÷ 20 × 100 = 15% lateness rate
Do Not Measure Only the Number of Late Arrivals
The amount of late time matters too.
Compare:
Employee A: Late 8 times by approximately 2 minutes
Employee B: Late 3 times by approximately 45 minutes
Employee A has a higher lateness frequency, while Employee B has substantially more lost scheduled time.
A useful attendance dashboard should therefore show both:
- Number of late arrivals
- Total or average late minutes
How Day Off Helps Track Lateness
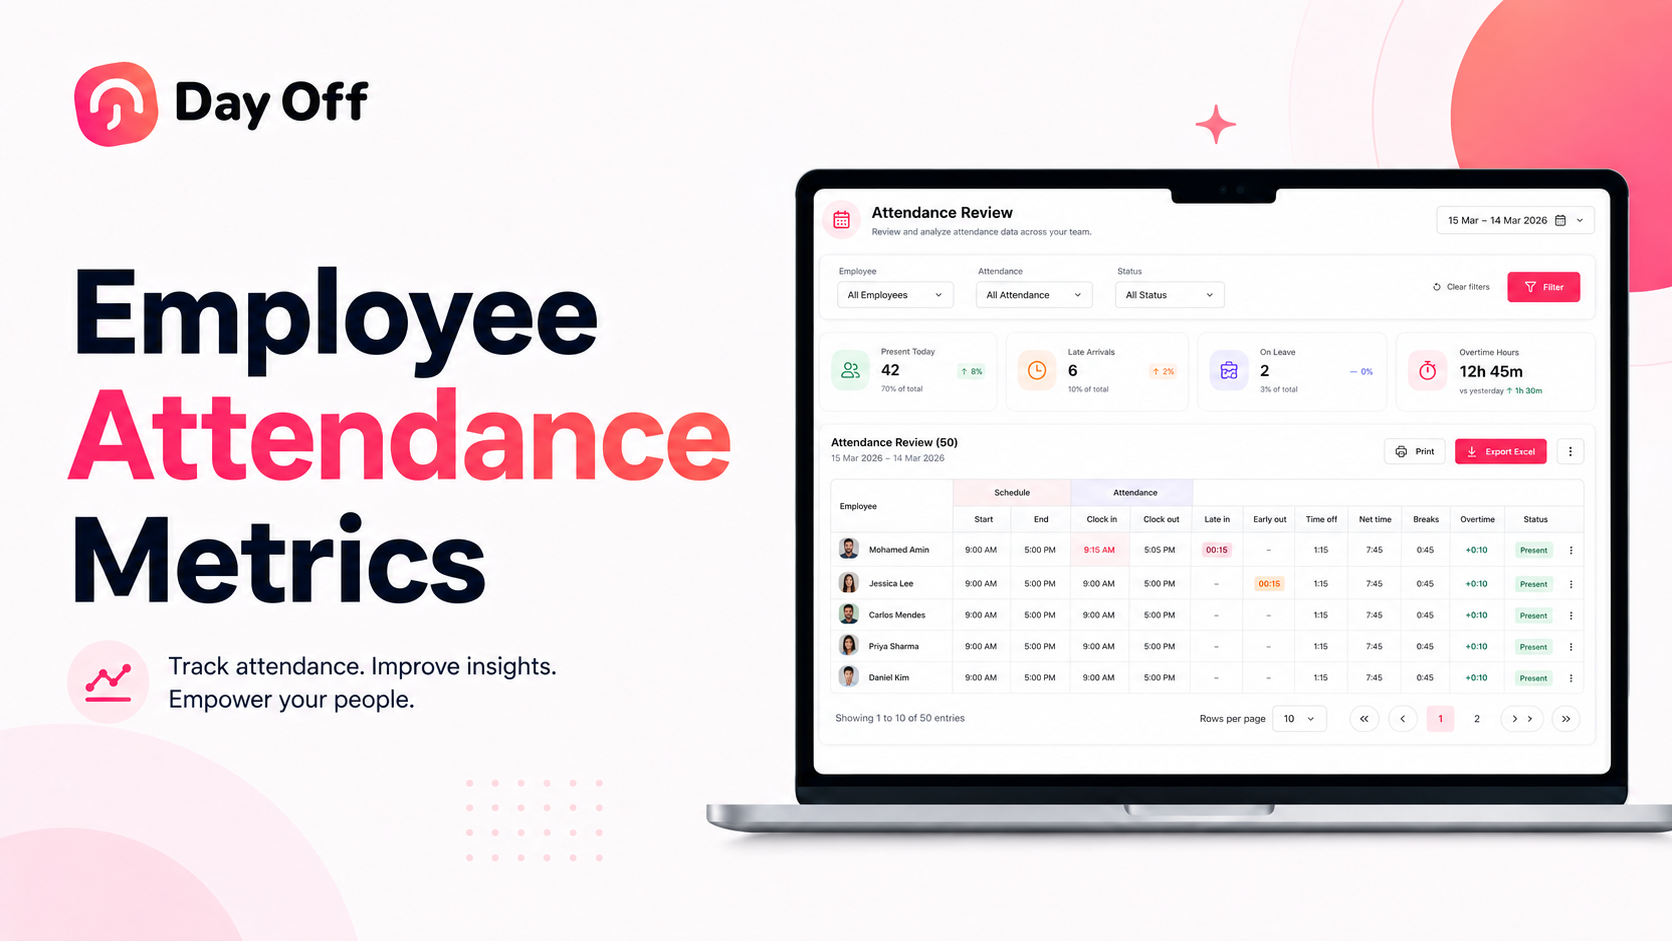
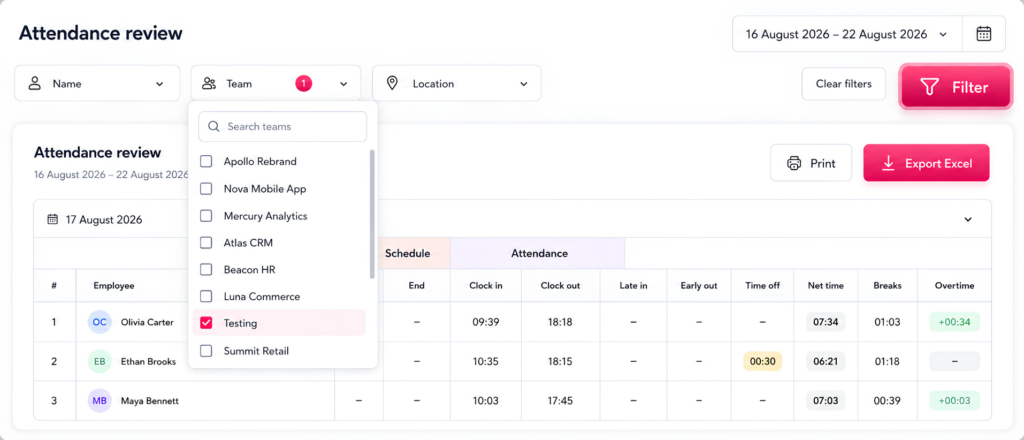
Day Off’s Attendance Review compares an employee’s assigned work schedule with their actual recorded attendance.
The report can show scheduled start and end times alongside actual clock-in and clock-out times, including Late In values when an employee arrives after their scheduled start.
This makes it easier to identify lateness from the schedule data rather than calculating every difference manually.
Early Departure Rate
Attendance problems do not only happen at the beginning of a shift.
Employees may also leave before their scheduled finishing time.
The early departure rate measures how frequently this occurs.
A basic formula is:
Early Departure Rate = Early Departures ÷ Scheduled Shifts × 100
Example
An employee worked 40 scheduled shifts during a two-month period and left early on four occasions.
4 ÷ 40 × 100 = 10% early departure rate
As with lateness, the number of incidents should be reviewed alongside the amount of time involved.
Leaving five minutes early is different from regularly leaving two hours before the scheduled end of a shift.
What HR Should Investigate
Repeated early departures might indicate:
- Schedule conflicts
- Transportation problems
- Incorrect schedules
- Workload issues
- Employee availability changes
- Attendance-policy issues
- Approved arrangements that have not been reflected in the schedule
Check the underlying circumstances before drawing conclusions.
In Day Off, Attendance Review includes Early Out alongside scheduled end time and actual clock-out time, helping managers identify the difference between expected and actual attendance.
Employee No-Show Rate
A no-show generally occurs when an employee is expected to work but does not attend and there is no approved time off or other recorded explanation.
No-shows are particularly important for shift-based organizations because an unexpected missing employee can immediately affect coverage.
A basic formula is:
No-Show Rate = Unexplained Missed Shifts ÷ Scheduled Shifts × 100
Example
A restaurant scheduled 1,000 employee shifts during a month.
Eight shifts had no employee attendance and no approved time-off record.
8 ÷ 1,000 × 100 = 0.8% no-show rate
Why HR Should Track No-Shows Separately
A no-show is not the same thing as:
- Approved vacation
- Sick leave reported correctly
- A company holiday
- A scheduled day off
- An employee working a different approved schedule
- An incomplete time record
Combining these situations can make attendance reporting unreliable.
This is where connecting PTO management with attendance tracking becomes particularly useful.
Day Off links work schedules, time tracking, and time-off records. Its Attendance Review can show approved time off alongside attendance information, and administrators can add a day off when an employee has no clock-in record and the missing attendance was actually caused by leave.
That reduces the risk of treating approved leave as an unexplained absence.
Schedule Variance
One of the most useful attendance metrics is also one of the simplest:
Schedule Variance = Actual Net Working Hours – Scheduled Hours
Schedule variance tells managers whether employees worked more or fewer hours than planned.
Example: Fewer Hours Than Scheduled
Scheduled: 40 hours
Actual net working time: 37.5 hours
37.5 – 40 = -2.5 hours
The employee has a negative schedule variance of 2.5 hours.
Example: More Hours Than Scheduled
Scheduled: 40 hours
Actual net working time: 44 hours
44 – 40 = +4 hours
The employee worked four hours more than scheduled.
Why Schedule Variance Matters
Schedule variance is useful for both attendance management and workforce planning.
Imagine a department schedules:
800 employee hours per month
but employees regularly work:
930 hours
That creates:
+130 hours of monthly schedule variance
Managers should investigate questions such as:
- Is the team understaffed?
- Are schedules unrealistic?
- Is workload higher than expected?
- Are certain shifts regularly understaffed?
- Are employees repeatedly staying beyond scheduled hours?
- Is additional hiring required?
- Could work be distributed differently?
The opposite pattern matters too.
If a business schedules significantly more hours than employees actually work, scheduling assumptions may need adjustment.
Scheduled vs. Actual Hours in Day Off
Day Off provides the expected schedule and actual attendance in the same Attendance Review.
HR can compare:
- Scheduled start
- Scheduled end
- Actual clock-in
- Actual clock-out
- Late time
- Early departure
- Time off
- Breaks
- Net working time
- Overtime
The report is built around the difference between the employee’s assigned schedule and actual attendance.
Overtime Rate
Overtime should not only be reviewed when payroll is processed.
Tracking overtime as an attendance KPI can help HR understand how workforce capacity is being used.
A useful formula is:
Overtime Rate = Overtime Hours ÷ Total Worked Hours × 100
Example
A department recorded:
2,000 total worked hours
including:
160 overtime hours
The overtime rate is:
160 ÷ 2,000 × 100 = 8%
Why Overtime Rate Matters
An increasing overtime rate can indicate:
- Understaffing
- Seasonal demand
- Poor scheduling
- Unexpected absence
- High workloads
- Inefficient shift allocation
- A temporary business surge
- Certain employees carrying disproportionate workloads
Overtime is not automatically negative.
During a short-term busy period, additional hours may be expected. But when high overtime continues for months, HR and operations teams may need to reconsider staffing levels and schedules.
Track Overtime by More Than Employee
Useful breakdowns include:
- Employee
- Team
- Location
- Department
- Week
- Month
- Shift
- Manager
For example, if total company overtime appears normal but one location accounts for 60% of it, the company-level average may hide an operational problem.
Day Off calculates overtime using employees’ assigned work schedules and displays overtime in Attendance Review, allowing managers to compare it with scheduled and actual working time.
Missed Punch and Timekeeping Error Rate
Attendance reporting is only useful when the underlying records are reliable.
If employees frequently forget to clock in or clock out, HR may spend significant time correcting timesheets before payroll.
A missed punch rate helps measure the quality of attendance data.
One possible formula is:
Missed Punch Rate = Missing Punches ÷ Expected Punches × 100
Example
Suppose 50 employees each work 20 shifts.
If every shift requires one clock-in and one clock-out:
50 × 20 × 2 = 2,000 expected punches
If 30 punches are missing:
30 ÷ 2,000 × 100 = 1.5% missed punch rate
Other Timekeeping Errors to Monitor
HR may also track:
- Missing clock-outs
- Missing clock-ins
- Duplicate punches
- Manual corrections
- Incomplete timers
- Incorrectly assigned shifts
- Unusually long recorded shifts
- Incorrect time-off classifications
Why This Metric Matters
A high error rate creates more than inaccurate reports.
It can create:
- Additional manager administration
- Payroll corrections
- Employee questions
- Unreliable overtime calculations
- Distorted attendance metrics
- Poor workforce-planning data
The goal should therefore be to improve the quality of the data before relying heavily on sophisticated attendance KPIs.
Day Off’s Attendance Review makes incomplete records easier to identify. For example, a clock-in without a corresponding clock-out leaves the day’s net time incomplete, allowing managers to investigate the missing record.
Employee Attendance Metrics at a Glance
| Attendance Metric | Basic Formula | What It Helps Measure |
|---|---|---|
| Attendance Rate | Attended workdays ÷ expected workdays × 100 | Overall attendance consistency |
| Absence Rate | Absence hours ÷ scheduled hours × 100 | Working time lost to absence |
| Absence Frequency | Number of separate absence incidents | Repeated absence patterns |
| Unplanned Absence Rate | Unplanned absence hours ÷ scheduled hours × 100 | Unexpected workforce availability problems |
| Lateness Rate | Late arrivals ÷ scheduled starts × 100 | Frequency of late arrivals |
| Early Departure Rate | Early departures ÷ scheduled shifts × 100 | Frequency of employees leaving early |
| No-Show Rate | Unexplained missed shifts ÷ scheduled shifts × 100 | Unexpected missed shifts |
| Schedule Variance | Actual net hours – scheduled hours | Difference between planned and actual work |
| Overtime Rate | Overtime hours ÷ total worked hours × 100 | Dependence on additional working hours |
| Missed Punch Rate | Missing punches ÷ expected punches × 100 | Timekeeping data quality |
How to Build a Useful Employee Attendance Dashboard
Having the metrics is only the first step.
The way HR organizes and interprets attendance information determines whether the dashboard actually improves decision-making.
Establish Clear Definitions
Document exactly what your organization means by:
- Absent
- Late
- No-show
- Early departure
- Scheduled hours
- Worked hours
- Overtime
- Approved leave
- Unplanned absence
- Missed punch
Without common definitions, managers may classify identical events differently.
That makes company-wide comparisons unreliable.
Separate PTO From Unplanned Absence
Approved vacation should not automatically appear as an attendance problem.
Your attendance system should know that an employee was scheduled to work but had approved time off.
This is one of the advantages of using a combined leave and attendance system.
With Day Off, employee work schedules, approved leave, and tracked attendance can be viewed together rather than being maintained in completely separate systems. Attendance Review specifically includes time off alongside schedule and attendance information.
Compare Similar Employees and Schedules
Do not compare raw attendance numbers without considering employee schedules.
An employee working three shifts per week and another working five shifts per week have different exposure to attendance events.
The same problem appears when comparing:
- Full-time and part-time employees
- Day and night shifts
- Fixed and flexible schedules
- Office and field teams
- Different locations
- Seasonal staff
Whenever possible, normalize attendance metrics using percentages or rates.
Review Trends, Not Only Individual Incidents
One late arrival does not establish a trend.
Instead, compare:
- This week vs. last week
- This month vs. last month
- Current quarter vs. previous quarter
- Current year vs. previous year
Patterns are more useful than isolated events.
Segment Attendance Data
A company-wide absence rate might look normal while one department has a significant attendance problem.
HR should be able to filter or group information by dimensions such as:
- Employee
- Team
- Department
- Location
- Shift
- Manager
- Date
- Schedule
Day Off’s Attendance Review can be filtered by employee, team, location, and date range, including custom periods. Filtered attendance information can also be printed or exported to Excel for additional analysis.
Investigate the Cause Behind the Metric
A metric tells you what happened.
It rarely tells you why.
For example, rising lateness may result from:
- Employee behavior
- Incorrect scheduled start times
- Transportation disruption
- A change in work location
- Unrealistic shift patterns
- A manager changing expectations without updating schedules
HR should combine attendance data with operational context before making decisions.
How Day Off Helps HR Track Employee Attendance
Day Off combines leave management, employee work schedules, attendance tracking, and time tracking in the same platform.
Instead of reviewing PTO in one system and employee attendance in another, managers can compare planned working time, actual working time, and approved time off together.
Set Employee Work Schedules
Companies can create work schedules according to how different teams operate.
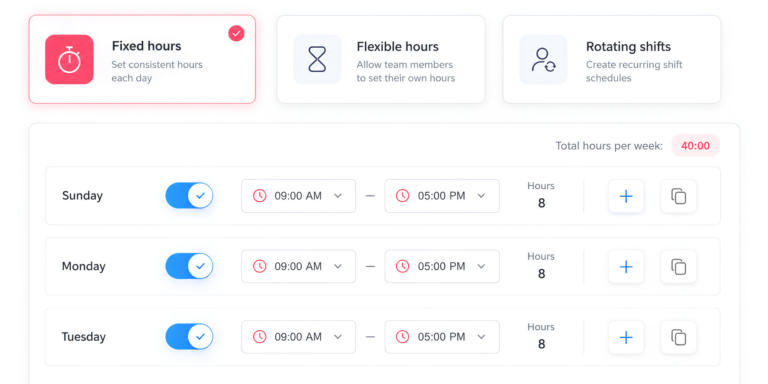
Day Off currently supports:
- Fixed Days, for employees who work defined days without specific daily start and end times
- Fixed Hours, for employees with specific start and end times
- Flexible Hours, for employees required to work a certain number of hours without strict start and end times
- Rotating Shifts, for schedules that change across multi-week cycles
Fixed Hours can also support split working periods within the same day.
These schedules create the baseline needed to compare expected attendance with actual employee time.
Track Clock-In and Clock-Out Time
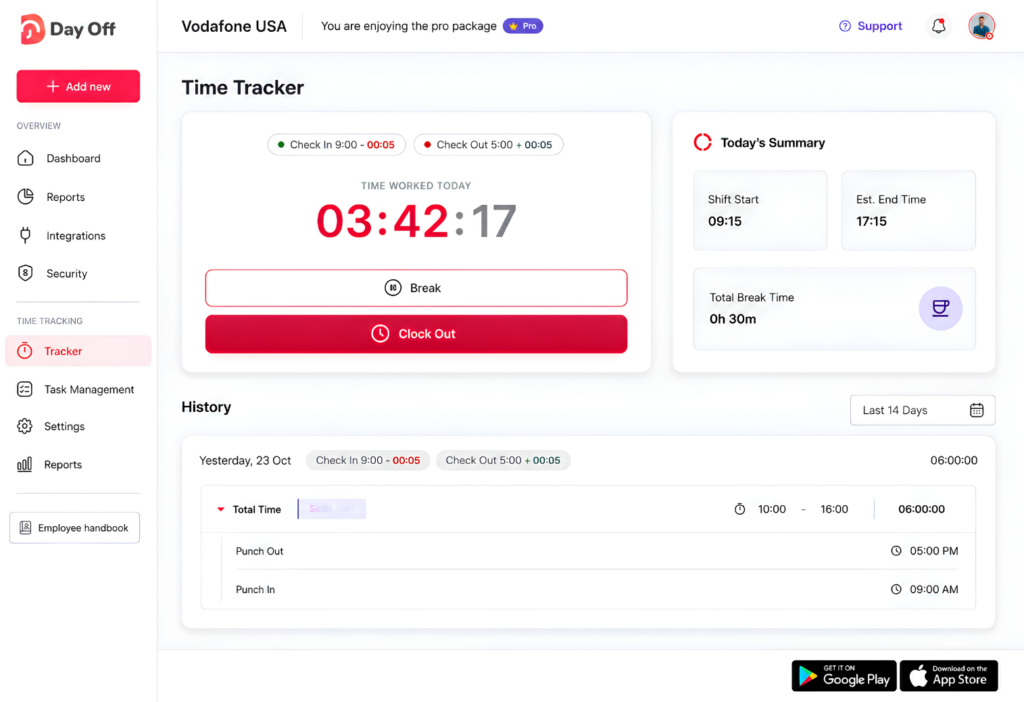
Companies that primarily need attendance records can use Day Off’s Clock In / Clock Out tracking method.
Employees record when they start and finish their working day, giving managers a digital record of actual attendance.
Companies needing more detailed working-time information can instead use Task Tracker, where time can be recorded against projects and tasks.
Review Attendance Against the Schedule
The Attendance Review provides one of the most useful views for HR teams because it places expected and actual working time side by side.
Managers can review:
- Scheduled start
- Scheduled end
- Clock-in
- Clock-out
- Late arrival
- Early departure
- Time off
- Net working hours
- Breaks
- Overtime
This helps HR move beyond simply knowing when somebody clocked in.
The data can be used to investigate the attendance metrics discussed throughout this article.
Keep Leave and Attendance Connected
An employee who does not clock in is not necessarily absent without explanation.
They may be on approved vacation, sick leave, personal leave, or another form of time off.
Because Day Off connects leave and attendance information, managers can see time-off information directly within the attendance review rather than manually reconciling separate leave and timekeeping systems.
Filter Attendance Data
HR teams can filter Attendance Review by:
- Employee
- Team
- Location
- Date range
This makes it possible to investigate specific attendance trends instead of reviewing the entire organization every time.
Export Attendance Information
Attendance and time-tracking information can also be exported for purposes such as:
- Payroll preparation
- Attendance audits
- HR analysis
- Management reports
- Timesheet reviews
- Workforce planning
Day Off provides export options for attendance and time-tracking reports, including Excel exports.
Common Attendance Tracking Mistakes HR Should Avoid
Treating Approved PTO as Poor Attendance
An employee using approved vacation is not the same as an employee unexpectedly missing a shift.
Keep the categories separate.
Measuring Frequency Without Measuring Duration
Ten two-minute late arrivals and ten one-hour late arrivals have the same frequency but dramatically different effects on working time.
Track both incidents and duration.
Looking Only at Individual Employees
Attendance patterns can originate from scheduling or operational problems.
Always compare individual metrics with:
- Team averages
- Location averages
- Shift patterns
- Historical trends
Using Percentages Without Checking the Raw Numbers
A 10% no-show rate sounds serious.
But if it represents one missed shift out of ten during a very short measurement period, HR needs more data before identifying a long-term trend.
Always examine the numerator, denominator, and measurement period.
Ignoring Missing Attendance Records
If your source data contains frequent missing clock-outs or manual corrections, the calculated attendance metrics may also be wrong.
Measure data quality before relying on the dashboard.
Comparing Different Metrics as If They Were Identical
An absence rate from one company, government report, or HR platform may be calculated differently from another.
Document your formulas and definitions before benchmarking results.
Using Metrics as Automatic Disciplinary Triggers
Attendance metrics should help HR identify situations requiring review.
They should not replace policy interpretation, conversations with employees, legal requirements, protected leave considerations, or human judgment.
How Often Should HR Review Attendance Metrics?
The best reporting frequency depends on the metric.
Daily
Review operational exceptions such as:
- No-shows
- Missing clock-ins
- Missing clock-outs
- Late arrivals
- Early departures
- Active attendance issues
Weekly
Review:
- Lateness trends
- Schedule variance
- Overtime
- Missing punches
- Team attendance patterns
Monthly
Analyze:
- Attendance rates
- Absence rates
- Unplanned absence
- Overtime trends
- Department comparisons
- Location comparisons
Quarterly
Look for longer-term workforce patterns, policy problems, recurring staffing gaps, or changes in attendance behavior.
The purpose of the monthly or quarterly review should not be to recheck every individual punch.
It should be to identify meaningful patterns that daily attendance management may not reveal.
Frequently Asked Questions About Employee Attendance Metrics
What are the most important employee attendance metrics to track?
The most important employee attendance metrics include attendance rate, absenteeism rate, absence frequency, lateness rate, early departure rate, no-show rate, overtime rate, schedule variance, unplanned absence rate, and missed punch rate.
HR teams do not necessarily need to give every metric equal importance. A shift-based business may focus heavily on late arrivals and no-shows, while another organization may find scheduled vs. actual hours and overtime more useful.
The best approach is to choose metrics that help HR identify real attendance, scheduling, and workforce availability problems.
How do you calculate employee attendance rate?
A common employee attendance rate formula is:
Attendance Rate = Days Present ÷ Scheduled Working Days × 100
For example, if an employee was expected to attend 20 working days and attended 19:
19 ÷ 20 × 100 = 95% attendance rate
Companies should establish clear rules for approved PTO, holidays, remote work, and other excused absences before calculating attendance. Approved leave generally should be separated from unexplained or unplanned absence so the metric accurately reflects attendance behavior.
How do you calculate employee absenteeism rate?
One practical way to calculate employee absenteeism is:
Absenteeism Rate = Absent Hours ÷ Scheduled Work Hours × 100
For example, if an employee was scheduled for 160 hours during a month and had 8 hours of qualifying absence:
8 ÷ 160 × 100 = 5% absenteeism rate
Some organizations calculate absenteeism using days instead of hours. Whichever method you choose, use the same definition consistently across employees, teams, locations, and reporting periods.
What is a good employee attendance rate?
There is no single attendance rate that is considered good for every workplace.
An appropriate benchmark depends on factors such as the industry, employee schedules, type of work, company leave policies, location, and how the organization defines an absence.
Instead of relying only on a universal percentage, HR should compare:
- Current attendance with previous periods
- Similar teams or locations
- Planned PTO versus unplanned absence
- Attendance trends over several months
- The frequency and duration of attendance issues
A declining attendance rate is often more useful to investigate than whether an employee falls above or below an arbitrary company-wide percentage.
What is the difference between attendance rate and absenteeism rate?
Attendance rate measures how much scheduled work employees attend, while absenteeism rate measures how much scheduled working time is missed.
For example, an attendance rate may show that an employee attended 95% of expected working days, while an absenteeism metric focuses specifically on the time lost because of qualifying absences.
HR should also distinguish between approved PTO and unplanned absence. Vacation, approved personal leave, scheduled days off, and holidays should not automatically be classified as attendance problems.
Using a system such as Day Off helps keep these records connected. HR can manage employee leave and work schedules while using Attendance Review to compare scheduled hours with actual clock-in and clock-out information, late arrivals, early departures, time off, net working hours, and overtime.
Final Thoughts
Employee attendance metrics give HR a clearer picture of how planned working time compares with what actually happens across the workforce.
But no single KPI provides the whole story.
An absence rate can show how much working time is being lost, while absence frequency shows whether the problem consists of one extended absence or many separate incidents. Lateness and early-departure metrics reveal problems at the edges of a shift. Schedule variance and overtime show whether employees are working more or fewer hours than planned. Missed punch rates reveal whether the attendance data itself can be trusted.
The strongest attendance reporting system therefore combines several metrics and keeps them connected to the employee’s actual work schedule and approved time off.
With Day Off, HR teams can manage employee leave, configure work schedules, track working time, and compare scheduled and actual attendance from the same platform. Attendance Review brings together clock-ins, clock-outs, late time, early departures, time off, breaks, net working hours, and overtime, helping managers turn everyday attendance records into information they can actually use.
The goal is not to track employees simply for the sake of tracking them.
It is to create accurate attendance data that helps HR understand workforce availability, identify exceptions earlier, improve scheduling decisions, and manage working time more effectively.