







An Employee Absence Rate Calculator measures the percentage of scheduled working time employees miss during a defined period. Instead of looking only at the number of people who were absent, it compares the time lost with the time employees were expected to work.
For example, knowing that a department recorded 80 hours of absence does not provide enough context. Eighty hours may be a serious staffing problem for a small team scheduled to work 800 hours, but it may have little operational effect in a large department scheduled to work 20,000 hours. The absence rate places those lost hours into context by converting them into a percentage.

HR teams and managers can use this metric to monitor attendance trends, understand workforce availability, compare teams, forecast coverage needs, and investigate whether scheduling or workplace conditions may be contributing to repeated absences.
However, the calculation must be designed carefully. Employers need to define which absence types are included, use each employee’s real scheduled hours, separate planned leave from unplanned absence, and avoid comparing internal results with external benchmarks that use a different formula.
This guide explains how to calculate an employee absence rate using hours or workdays, how to interpret the result, which benchmarks are available, and how to use absence data responsibly.
Employee Absence Rate Calculator
The most accurate formula for many workplaces is:
Employee absence rate = (Total absent working hours ÷ Total scheduled working hours) × 100
The calculation answers a simple question:
What percentage of the working time employees were expected to provide was lost to the absence categories being measured?
Information needed for the calculation
Before calculating the rate, collect:
- The total scheduled working hours for the selected employees
- The total scheduled hours missed because of absence
- The start and end dates of the reporting period
- The employees, department, location, or company being measured
- A clear list of absence types included in the total
Quick calculation example
A customer service department was scheduled to work 4,000 hours during one month. Employees missed 100 of those hours because of unplanned sickness and emergency absences.
Step 1: Divide absent hours by scheduled hours.
100 ÷ 4,000 = 0.025
Step 2: Multiply the result by 100.
0.025 × 100 = 2.5%
The department’s unplanned absence rate was 2.5%.
This means that 2.5 of every 100 scheduled working hours were lost to the absence categories included in the calculation.
The UK Office for National Statistics uses the same general time-loss approach when defining its sickness absence rate as the percentage of working hours lost because of sickness or injury.
What Is an Employee Absence Rate?
An employee absence rate is a percentage showing how much scheduled working time was missed during a particular period.
It can be calculated for:
- An individual employee
- A team
- A department
- A business location
- A specific shift
- The entire organization
- A month, quarter, or year
- One type of absence, such as sickness
- A group of absence types, such as all unplanned absences
The value of the metric depends on how clearly it is defined.
For example, the following are three different measurements:
- Total absence rate: All selected hours of scheduled work that employees did not perform
- Sickness absence rate: Scheduled hours missed specifically because of illness or injury
- Unplanned absence rate: Scheduled hours missed without advance planning, such as unscheduled sickness, emergencies, or unauthorized absence
These results should not be combined or compared as though they measure the same thing.
A company reporting a 4% total absence rate may actually have a lower unplanned attendance problem than another company reporting a 3% rate if the first calculation includes scheduled parental leave and the second includes only call-outs and no-shows.
Why Should Employers Calculate Absence Rates?
Counting individual absence days can help with recordkeeping, but the absence rate gives employers a more useful view of how absence affects available workforce capacity.
It creates context
A raw number does not show the size of the workforce affected.
For example:
- Team A loses 40 hours from 800 scheduled hours.
- Team B loses 40 hours from 4,000 scheduled hours.
Although both teams lost the same number of hours:
- Team A’s rate is 5%.
- Team B’s rate is 1%.
The operational impact is therefore very different.
It supports workforce planning
When managers know the average percentage of scheduled time usually lost, they can make more informed decisions about:
- Minimum staffing levels
- Shift coverage
- Temporary employees
- Seasonal staffing
- Overtime budgets
- Cross-training
- Project deadlines
- Customer support capacity
It identifies patterns
The company-wide rate may look stable while one location, team, shift, or month experiences a significant increase.
Breaking the calculation down can reveal:
- Seasonal sickness patterns
- Repeated Monday or Friday absences
- Higher absence on specific shifts
- Departments with persistent understaffing
- Workloads that may be contributing to fatigue
- Managers who need more support with attendance procedures
It measures change over time
A single month does not always provide enough information. Tracking the same calculation over several periods can show whether the rate is increasing, decreasing, or remaining stable.
This is particularly useful after the organization introduces:
- A new attendance policy
- Flexible schedules
- A wellbeing initiative
- A return-to-work process
- A shift redesign
- Additional staffing
- A new absence reporting system
The rate should be one part of the evaluation, not the only measure of whether the change was successful.
Absence Rate vs. Absenteeism Rate
The terms absence rate and absenteeism rate are often used as though they mean the same thing. In practice, employers may use them for different purposes.
Absence rate
An absence rate may include any selected category of missed scheduled time, whether the absence was planned or unplanned.
Depending on the report, it might include:
- Sickness
- Parental leave
- Bereavement leave
- Jury duty
- Unpaid leave
- Approved personal leave
- Unauthorized absence
Absenteeism rate
An absenteeism rate is often used more narrowly to measure unexpected or unscheduled absence.
It might include:
- Unscheduled sickness
- Emergency call-outs
- No-call, no-show
- Unauthorized absence
- Unplanned lateness
- Unplanned early departure
There is no single universal definition that every employer, government agency, and HR platform follows. The organization should therefore document its own definition.
For example:
The company’s unplanned absenteeism rate includes scheduled working hours missed because of unscheduled sickness, personal emergencies, unauthorized absence, late arrival, and early departure. It excludes approved vacation, scheduled medical leave, public holidays, business travel, and non-working days.
This definition makes the percentage easier to interpret and reproduce.
Which Absence Types Should Be Included?
The correct categories depend on the purpose of the report.
An operational report designed to show workforce availability may include more absence categories than an attendance report intended to measure unplanned call-outs.
Total workforce availability
A broad availability report may include:
- Sickness absence
- Parental leave
- Family-care leave
- Bereavement leave
- Unpaid leave
- Jury duty
- Military leave
- Personal emergencies
- Unauthorized absence
- Partial-day absence
This calculation helps managers understand how much scheduled capacity was unavailable, regardless of why the absence occurred.
It should not automatically be used for disciplinary decisions because many included absences may be approved or legally protected.
Unplanned absence
A narrower unplanned absence report may include:
- Unscheduled illness
- Emergency personal absence
- Unauthorized absence
- No-call, no-show
- Late arrival
- Early departure
It would usually exclude:
- Approved vacation
- Scheduled parental leave
- Pre-approved medical leave
- Public holidays
- Training
- Business travel
- Scheduled days off
Sickness absence
A sickness absence rate should normally contain only working time lost because of illness, injury, medical treatment, or recovery, depending on the organization’s written definition.
Keeping sickness separate from other leave types helps HR identify genuine health-related trends instead of mixing them with vacation and personal leave.
The U.S. Bureau of Labor Statistics includes illness, injury, childcare problems, family obligations, civic or military duty, and maternity or paternity leave in its published absence measure. It excludes vacation, holidays, personal days, labor disputes, and certain other reasons.
What Counts as Scheduled Working Time?
Scheduled working time is the amount of time employees were actually expected to work during the reporting period.
This denominator is essential. If it is too high or too low, the final percentage will be misleading.
Include
The scheduled-hours total may include:
- Regular scheduled shifts
- Part-time schedules
- Approved additional shifts
- Required weekend hours
- Scheduled overnight work
- Temporary schedule changes
- Mandatory meetings during working time
Exclude
It should normally exclude:
- Scheduled days off
- Unpaid meal breaks
- Public holidays when the employee was not expected to work
- Time before a new employee’s start date
- Time after an employee’s termination date
- Vacant positions
- Hours outside the employee’s assigned schedule
Why actual schedules matter
Assuming that every employee works eight hours per day can create major errors.
Consider three employees:
- Employee A works five eight-hour days.
- Employee B works four 10-hour days.
- Employee C works five four-hour shifts.
If each employee misses one full scheduled day, their absent hours are:
- Employee A: 8 hours
- Employee B: 10 hours
- Employee C: 4 hours
Counting every absence as “one day” hides these differences. Hours-based calculations provide a more accurate view of the time the business actually lost.
How to Calculate Absence Rate Using Hours
The hours-based formula is usually the best option for workplaces with part-time employees, flexible hours, compressed schedules, rotating shifts, or partial-day absences.
Formula
Absence rate = (Absent working hours ÷ Scheduled working hours) × 100
Example 1: One employee
An employee was scheduled for 160 hours during June and missed 12 hours because of illness.
12 ÷ 160 × 100 = 7.5%
The employee’s sickness absence rate for June was 7.5%.
This does not mean the employee was absent for 7.5% of the calendar month. It means the employee missed 7.5% of the time they were scheduled to work.
Example 2: A department
A department had 20 employees who were scheduled for a combined 3,200 hours. Employees missed 64 scheduled hours.
64 ÷ 3,200 × 100 = 2%
The department’s monthly absence rate was 2%.
Example 3: Annual company rate
A company recorded:
- 104,000 scheduled hours
- 2,600 absent hours
2,600 ÷ 104,000 × 100 = 2.5%
The company’s annual absence rate was 2.5%.
This result can then be compared with:
- The previous year
- Other company locations
- Individual departments
- Monthly trends
- Relevant external statistics using a comparable formula
Example 4: Partial-day absences
An employee was scheduled to work four 10-hour shifts during one week. The employee:
- Arrived two hours late on Monday
- Missed a full 10-hour shift on Wednesday
- Left one hour early on Thursday
Total absent time:
2 + 10 + 1 = 13 hours
Total scheduled time:
40 hours
13 ÷ 40 × 100 = 32.5%
The employee’s absence rate for that week was 32.5%.
This example also shows why very short reporting periods can produce dramatic percentages. One difficult week should be reviewed alongside monthly, quarterly, and annual trends before conclusions are made.
How to Calculate Absence Rate Using Workdays
The days-based formula is:
Absence rate = (Absent workdays ÷ Available workdays) × 100
Example
A department has 10 employees. Each employee was scheduled for 22 workdays during the month.
Total available workdays:
10 × 22 = 220 days
Employees missed a combined six full workdays.
6 ÷ 220 × 100 = 2.73%
The department’s absence rate was approximately 2.7%.
When the days-based method is useful
It can provide a reasonable result when:
- Employees work the same number of hours each day
- Everyone has a similar schedule
- Most absences cover complete days
- Partial-day absences are uncommon
- Schedule changes are limited
When it becomes inaccurate
The days-based method can distort the result when:
- Some employees work four-hour days and others work 12-hour shifts
- Employees use rotating schedules
- Part-time hours vary
- The business uses compressed workweeks
- Partial-day absences are frequent
- Shift lengths change from week to week
In these cases, use scheduled hours instead of days.
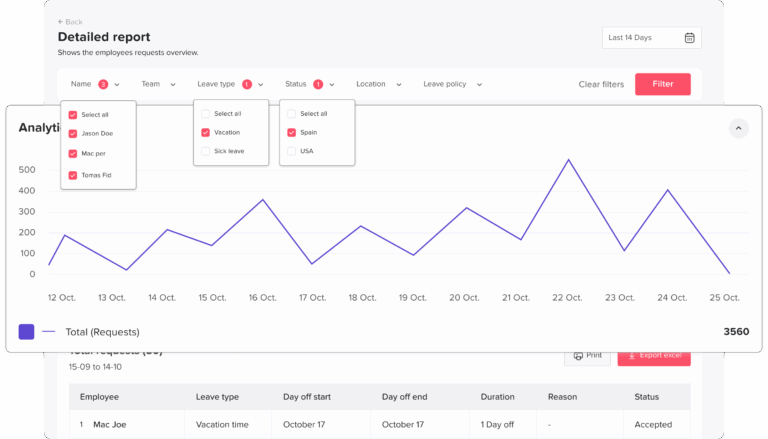
| Scenario | Scheduled Time | Absent Time | Calculation | Result |
|---|---|---|---|---|
| Employee misses one day from a 160-hour month | 160 hours | 8 hours | 8 ÷ 160 × 100 | 5% |
| Team loses 48 hours from a monthly schedule | 2,400 hours | 48 hours | 48 ÷ 2,400 × 100 | 2% |
| Department loses 15 of 500 workdays | 500 days | 15 days | 15 ÷ 500 × 100 | 3% |
| Employee misses part of a 40-hour week | 40 hours | 5 hours | 5 ÷ 40 × 100 | 12.5% |
| Company loses 3,000 annual hours | 120,000 hours | 3,000 hours | 3,000 ÷ 120,000 × 100 | 2.5% |
These examples demonstrate the formula only. They should not be treated as recommended targets or universal benchmarks.
How to Calculate Monthly Absence Rate
A monthly rate is useful for identifying recent changes without relying on a single day or week.
Step 1: Define the period
Use the same dates for both scheduled and absent time.
For example:
- August 1 through August 31
- A specific monthly payroll cycle
- A defined four-week reporting period
Do not calculate absent time for August against scheduled hours from July and August combined.
Step 2: Select the population
Decide whether the calculation covers:
- One employee
- One team
- A location
- A department
- The entire organization
Use the same population in both parts of the formula.
Step 3: Calculate scheduled hours
Add the actual hours employees were expected to work.
Adjust for:
- New hires
- Departing employees
- Part-time schedules
- Temporary schedule changes
- Public holidays
- Unpaid meal periods
- Approved reduced working hours
Step 4: Add absent hours
Include only the absence categories defined for that report.
For example, a sickness absence report should not suddenly include vacation hours simply because they are easy to retrieve.
Step 5: Complete the calculation
Suppose the department recorded:
- 75 absent hours
- 3,750 scheduled hours
75 ÷ 3,750 × 100 = 2%
Step 6: Label the result properly
Instead of reporting only “2%,” use a complete label:
Customer Support monthly unplanned absence rate for August: 2%.
This tells the reader:
- Which team was measured
- Which period was covered
- Which type of absence was included
- What the percentage represents
How to Calculate Annual Absence Rate
An annual absence rate provides a broader view and reduces the effect of temporary weekly or monthly fluctuations.
Use:
Annual absence rate = (Annual absent hours ÷ Annual scheduled hours) × 100
Annual example
A company had:
- 250 employees
- 480,000 total scheduled working hours
- 12,000 hours of sickness absence
12,000 ÷ 480,000 × 100 = 2.5%
The company’s annual sickness absence rate was 2.5%.
Important annual adjustments
The scheduled-hours total should account for:
- Employees who joined during the year
- Employees who left
- Changes from full-time to part-time work
- Schedule changes
- Periods when employees were not expected to work
- Business closures
- Approved reduced schedules
- Changes in department or location
Using the full-year theoretical hours for someone who joined in October would overstate the denominator and make the absence rate appear artificially low.
How to Calculate Absence Rate in Excel or Google Sheets
Suppose:
- Cell B2 contains absent hours
- Cell C2 contains scheduled hours
Use:
=IFERROR(B2/C2,0)
Format the result as a percentage.
If you do not apply percentage formatting, use:
=IFERROR(B2/C2*100,0)
Example
If B2 contains 64 and C2 contains 3,200:
=64/3200
The result is 0.02. When formatted as a percentage, it displays as 2%.
Calculating the total for several employees
If:
- B2 contains absent hours
- C2 contains scheduled hours
Use:
=IFERROR(SUM(B2:B51)/SUM(C2:C51),0)
This method is more accurate than averaging individual percentages when employees have different schedules.
Why averaging percentages can be wrong
Consider:
- Employee A: 8 absent hours from 160 scheduled hours = 5%
- Employee B: 8 absent hours from 40 scheduled hours = 20%
A simple average would produce 12.5%.
However, the real combined rate is:
16 absent hours ÷ 200 scheduled hours × 100 = 8%
The combined calculation correctly gives greater weight to the employee with more scheduled hours.
Current Employee Absence Rate Benchmarks
Benchmarks can provide useful context, but only when the definition and formula are understood.
Different sources may report:
- The percentage of employees absent
- The percentage of working hours lost
- Average absence days per employee
- Sickness-only absence
- A broader group of absence reasons
These measures cannot be compared directly without explaining their differences.
| Source | Measurement | Latest Reported Result | What It Means |
|---|---|---|---|
| U.S. Bureau of Labor Statistics, 2025 | Absence rate | 3.2% | Percentage of full-time wage and salary workers with an absence in an average week |
| U.S. Bureau of Labor Statistics, 2025 | Lost-worktime rate | 1.7% | Hours absent as a percentage of hours usually worked |
| UK Office for National Statistics, 2025 | Sickness absence rate | 2.0% | Percentage of working hours lost because of sickness or injury |
| UK Office for National Statistics, 2025 | Average days lost | 4.4 days | Estimated sickness or injury days lost per worker |
| CIPD employer survey, 2025 | Average sickness absence | 9.4 days | Employer-reported average days of sickness absence per employee |
The BLS reported a 2025 absence rate of 3.2% for full-time U.S. wage and salary workers and a lost-worktime rate of 1.7%. The first measure looks at the proportion of workers who had absences, while the second measures the proportion of usual working hours lost.
The UK Office for National Statistics estimated that 2.0% of working hours were lost because of sickness or injury in 2025, representing approximately 148.8 million lost workdays and an average of 4.4 days per worker.
The CIPD’s 2025 employer survey reported an average of 9.4 sickness absence days per employee, equivalent to approximately 4.1% in its participating organizations. Its research method and sample differ from the ONS national estimate, so the two figures should not be treated as contradictory versions of the same measurement.
What Is a Good Employee Absence Rate?
There is no single percentage that is good for every organization.
A meaningful evaluation should consider:
- The absence categories included
- The industry
- The type of work
- Employee schedules
- Workforce size
- The reporting period
- Seasonal patterns
- The organization’s historical rate
- The operational effect of absence
- The availability of paid and protected leave
A 2% sickness absence rate and a 2% total absence rate are not equivalent. The second may include parental leave, jury duty, bereavement, and other approved absences.
Use internal comparisons first
The most valuable benchmark is often the company’s own history calculated in the same way.
For example:
- Current year: 2.8%
- Previous year: 2.1%
- Three-year average: 2.3%
This suggests an increase that may deserve investigation.
Compare similar groups
A warehouse team should not automatically be compared with a remote software team. The jobs involve different physical demands, work environments, schedules, and opportunities for flexibility.
Consider operational impact
The same rate may affect companies differently.
A 2% rate may be manageable in a large team where several employees can perform the same work. It may cause serious disruption in a small specialist team where one absent person holds a critical skill.
Is a 2% Absence Rate High?
A 2% absence rate means two of every 100 scheduled working hours were lost to the absence categories included in the report.
It is not automatically high or low.
The interpretation depends on questions such as:
- Is the rate measuring sickness only?
- Is approved long-term leave included?
- Is this a monthly or annual rate?
- How does it compare with previous periods?
- Is the rate concentrated in one department?
- Is the company operating with limited staffing?
- Were there unusual events during the period?
For context, the ONS reported a 2.0% UK sickness absence rate in 2025. Within that data, the rate was 2.9% for public-sector employees and 1.7% for private-sector employees.
A company should not treat 2% as a universal target merely because it matches a national figure. Its employees, industry, and measurement method may be very different.
Why External Benchmarks Must Be Used Carefully
Different formulas produce different results
The BLS absence rate measures the proportion of full-time workers with an absence in an average week. Its lost-worktime rate measures hours absent as a percentage of hours usually worked. An employer’s internal hours-based calculation is closer to the second measurement.
Different absence types may be included
One benchmark may measure only sickness and injury. Another may include family obligations, parental leave, military duty, or other reasons.
Planned leave may be excluded
The BLS absence measure excludes vacation, holidays, and personal days. A company that includes these categories will naturally calculate a higher result.
Industries have different working conditions
Physical demands, customer contact, shift work, exposure to illness, schedule flexibility, and remote-work options can all influence absence.
The BLS reported a 2025 absence rate of 4.1% for healthcare support occupations, compared with 2.5% for management occupations.
Access to paid leave varies
In March 2025, 80% of private-industry employees and 93% of state and local government employees had access to paid sick leave. Benefit availability may influence whether and how employees report absence.
Absence Rate by Employee, Team, and Company
The calculation can be applied at several levels, but each level answers a different question.
Individual employee rate
An individual rate may help HR:
- Verify attendance records
- Identify repeated short absences
- Understand whether support may be needed
- Check whether schedules and leave records agree
- Review accommodation or protected-leave issues
A high individual percentage should never be interpreted without context.
One extended medical absence can produce a high rate even when the employee has no history of unreliable attendance. The reason, duration, legal status, and reporting period must be reviewed.
Team or department rate
A team-level rate can help managers:
- Plan coverage
- Compare shifts
- Identify workload concerns
- Review scheduling practices
- Detect seasonal patterns
- Evaluate staffing levels
If one team has a significantly higher rate than comparable teams, HR should investigate possible explanations rather than assume the employees are less committed.
Potential causes might include:
- Higher physical demands
- Excessive overtime
- Poor shift design
- Insufficient staffing
- Management issues
- Workplace safety concerns
- Limited flexibility
Company-wide rate
A company-wide rate is useful for:
- Executive dashboards
- Annual reporting
- Workforce planning
- Budgeting
- Year-over-year comparisons
- Evaluating broad wellbeing initiatives
However, a single company-wide figure can hide important differences. It should be supported by department, location, schedule, and absence-type analysis.
Absence Rate vs. Frequency and Duration
An absence rate measures the amount of working time lost. It does not explain how the absence occurred.
Two departments can lose the same number of hours through very different patterns.
Example
Department A records one employee absent for 20 days.
Department B records 20 employees absent for one day each.
Both departments lose 20 employee-days, but:
- Department A has one long absence.
- Department B has many separate short absences.
The appropriate management response may be completely different.
| Metric | Formula | What It Explains |
|---|---|---|
| Absence rate | Absent time ÷ scheduled time × 100 | The proportion of scheduled working time lost |
| Absence frequency | Number of absence incidents ÷ average employees × 100 | How often separate absence events occur |
| Average duration | Total absent days ÷ number of incidents | The average length of each absence |
Absence frequency example
A company with an average of 50 employees recorded 25 separate absence incidents during a quarter.
25 ÷ 50 × 100 = 50 incidents per 100 employees
Average duration example
A department recorded 36 absent days across 12 incidents.
36 ÷ 12 = 3 days per incident
The average absence lasted three working days.
Tracking all three metrics gives HR a clearer understanding of whether the organization is dealing mainly with frequent short-term absence, a small number of long-term cases, or both.
Common Absence Rate Calculation Mistakes
Counting calendar days instead of scheduled workdays
An employee who is sick from Friday through Monday has four calendar days of illness. If Saturday and Sunday were non-working days, the employee may have missed only two scheduled workdays.
Only scheduled working time should enter the calculation.
Assuming every day equals eight hours
This creates inaccurate results for:
- Part-time employees
- 10-hour shifts
- 12-hour shifts
- Rotating schedules
- Flexible schedules
Use the actual scheduled hours.
Including vacation in an unplanned absence rate
Approved vacation is planned and should normally be excluded when the purpose is to measure unexpected absence.
It may be included in a broader workforce-availability report, but that report should be labelled differently.
Averaging individual percentages
A simple average can distort the result when employees have different schedules.
Calculate:
Total absent hours ÷ total scheduled hours
This weights each employee according to their actual schedule.
Failing to adjust for new hires and leavers
An employee who worked for only three months should not be assigned a full year of scheduled hours.
Double-counting absence
The same missed shift should not be recorded as both sick leave and unpaid absence.
Including non-working time
Scheduled days off, unpaid meal periods, and public holidays should not be treated as missed working time when the employee was never expected to work.
Comparing different definitions
A sickness-only rate cannot be fairly compared with a total rate that includes parental, personal, and civic leave.
Using a very short period without context
Weekly rates can change dramatically because of one absence. Review them alongside monthly and rolling annual data.
How Often Should Absence Rates Be Calculated?
Weekly
Weekly reporting can help operational teams respond quickly to:
- Staffing shortages
- Active illness outbreaks
- Shift coverage problems
- Unexpected increases in call-outs
However, weekly rates are volatile and should not be used alone for long-term conclusions.
Monthly
Monthly reporting is useful for:
- HR dashboards
- Team comparisons
- Manager reviews
- Emerging attendance trends
- Seasonal analysis
It provides more stability than a weekly percentage while still allowing the organization to respond promptly.
Quarterly
Quarterly reporting helps leadership:
- Compare departments
- Review policy results
- Evaluate interventions
- Understand medium-term changes
- Reduce the effect of unusual individual weeks
Annually
Annual reporting is best for:
- Strategic workforce planning
- External benchmarking
- Budgeting
- Year-over-year comparisons
- Long-term wellbeing analysis
Rolling 12-month rate
A rolling 12-month figure is recalculated every month using the previous 12 months of data.
It provides a current annual view without waiting until the calendar year ends and reduces the effect of seasonal fluctuations.
How to Analyze Employee Absence Data
The organization-wide percentage shows the size of absence but not its cause.
Break the data down by:
- Department
- Location
- Manager
- Shift
- Work schedule
- Employment type
- Month
- Day of the week
- Planned or unplanned status
- Short-term or long-term duration
- Full-day or partial-day absence
- General absence category
Look for concentration
Ask:
- Is most absence concentrated in one team?
- Is a particular shift consistently affected?
- Are rates rising during a specific season?
- Is the increase caused by many short events or a few long cases?
- Did the rate change after a schedule or policy update?
Compare related operational data
Absence trends may be more meaningful when reviewed alongside:
- Overtime
- Employee turnover
- Workload
- Safety incidents
- Schedule changes
- Engagement feedback
- Customer complaints
- Staffing vacancies
For example, rising absence combined with increasing overtime may suggest workload or staffing problems rather than an issue that can be solved through stricter attendance rules alone.
Protect employee privacy
Managers usually do not need access to diagnoses or detailed medical information.
Reports can use general categories such as:
- Sickness
- Family leave
- Personal leave
- Protected leave
- Unauthorized absence
Sensitive documentation should be stored securely and accessed only by authorized people.
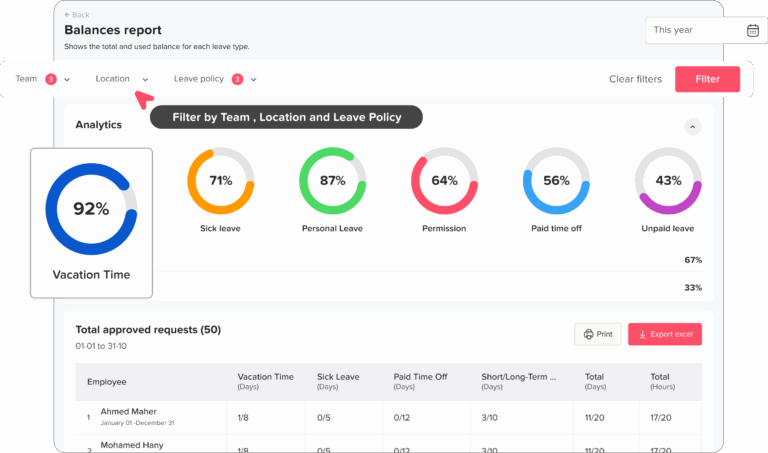
How to Reduce Employee Absence Responsibly
The goal should not be to discourage employees from staying home when sick or using leave they are legally entitled to take.
A responsible absence strategy focuses on reducing preventable disruption while supporting employees who genuinely need time away.
Review workloads and staffing
Persistent absence may be connected to:
- Chronic understaffing
- Excessive overtime
- Unrealistic deadlines
- Physically demanding shifts
- Insufficient recovery time
- Repeated last-minute schedule changes
Adding stricter attendance rules without addressing these conditions may fail to improve the rate.
Make reporting procedures clear
Employees should know:
- Who to contact
- How early to report an absence
- Which app, phone number, or system to use
- What basic information is required
- When documentation may be requested
- How to request protected leave or an accommodation
Confusing procedures can lead to misclassified or incomplete absence records.
Offer flexibility where practical
Depending on the role, options may include:
- Flexible start times
- Shift swaps
- Remote work
- Partial-day leave
- Temporary schedule adjustments
- Reduced schedules
- Reasonable accommodation
The EEOC explains that employers may need to modify leave or attendance procedures as a reasonable accommodation unless doing so would cause undue hardship.
Use return-to-work conversations
A short return-to-work discussion can help the manager:
- Confirm that the employee has returned
- Verify the recorded dates
- Correct the absence category
- Identify any workplace concerns
- Discuss temporary support
- Agree on follow-up actions
The conversation should be consistent and respectful. It should not become an unnecessary investigation into private medical details.
Train managers
Managers should understand:
- The attendance policy
- How to document absence
- When to contact HR
- Protected-leave escalation
- Privacy requirements
- Accommodation requests
- Anti-retaliation responsibilities
Poor manager handling can create inconsistent records and legal risk even when the written policy is reasonable.
Legal and Ethical Considerations
Absence statistics should support planning and informed management. They should not be used as an automatic disciplinary score.
Eligible employees of covered U.S. employers may receive job-protected leave under the Family and Medical Leave Act. FMLA leave may be unpaid or may run at the same time as employer-provided paid leave. Employees generally must be returned to the same or a virtually identical position after qualifying leave.
Employers may not interfere with FMLA rights or punish employees for using protected leave. Attendance systems should therefore ensure that protected FMLA time does not generate negative attendance points or disciplinary consequences.
The Americans with Disabilities Act may also require an employer to modify leave or attendance procedures as a reasonable accommodation unless the change would create an undue hardship.
Before using absence records for discipline, scheduling, promotion, or termination decisions, employers should identify and review:
- FMLA-protected leave
- Disability-related accommodation leave
- State or local paid sick leave
- Pregnancy-related leave
- Military leave
- Workers’ compensation absence
- Jury duty
- Other legally protected leave
Protected absence may still appear in a neutral workforce-capacity report. It should be separated from disciplinary attendance measures and clearly labelled.
How Day Off Helps Track Employee Absence
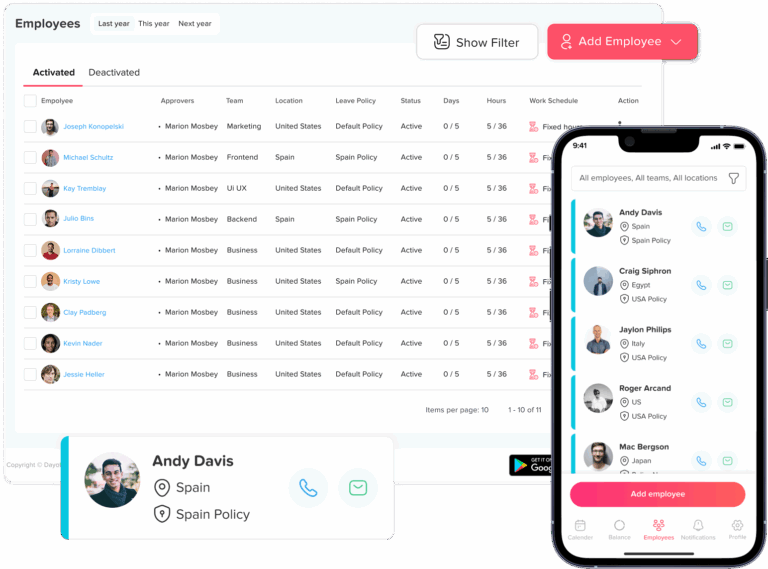
Manual absence calculations become difficult when employee schedules, leave requests, attendance records, and timesheets are stored in separate systems.
Day Off can help organizations keep related information in one place, including:
- Employee work schedules
- PTO and leave requests
- Approval history
- Full-day and partial-day absences
- Attendance status
- Clock-in and clock-out records
- Timesheets
- Public holidays
- Leave balances
- Absence reports
Using each employee’s real schedule improves accuracy.
A full-day absence may represent:
- Four hours for a part-time employee
- Eight hours for a standard employee
- Ten hours for someone on a 4/10 schedule
- Twelve hours for a shift worker
Centralized records also help HR separate approved vacation, sickness absence, unpaid leave, public holidays, and unauthorized absence before calculating each rate.
Frequently Asked Questions About Employee Absence Rates
How do you calculate an employee absence rate?
Divide the number of scheduled working hours employees missed by their total scheduled working hours, then multiply the result by 100.
Employee absence rate = (Absent hours ÷ Scheduled hours) × 100
For example, if employees missed 80 hours out of 4,000 scheduled hours:
80 ÷ 4,000 × 100 = 2%
What is the formula for calculating absenteeism?
A commonly used absenteeism formula is:
Absenteeism rate = (Unplanned absent time ÷ Total scheduled working time) × 100
The calculation can use hours or workdays. Hours are usually more accurate when employees have different schedules, shift lengths, or partial-day absences.
Should absence rate be calculated using hours or days?
Using hours is generally more accurate because it accounts for part-time schedules, 10- or 12-hour shifts, partial-day absences, late arrivals, and early departures.
A days-based calculation may work when all employees have similar schedules and most absences cover complete workdays.
What is a good employee absence rate?
There is no universal absence rate that is considered good for every employer. A useful target depends on the industry, occupation, workforce, reporting period, and types of absence included.
Employers should compare their results with previous periods and similar teams before relying on an external benchmark.
What is the average employee absence rate in the United States?
The U.S. Bureau of Labor Statistics reported a 3.2% absence rate for full-time wage and salary workers in 2025. It also reported a 1.7% lost-worktime rate, which measures absent hours as a percentage of hours usually worked.
An employer calculating absent hours divided by scheduled hours is using a method more comparable to the lost-worktime rate than the BLS absence rate.
Is a 2% employee absence rate high?
A 2% absence rate means employees missed two of every 100 scheduled working hours included in the calculation. It is not automatically high or low.
For context, the UK sickness absence rate was 2.0% in 2025, but that figure measured only working hours lost because of sickness or injury. It should not be compared directly with a company rate that includes vacation, parental leave, or other absences.
Is a 3% absenteeism rate high?
A 3% rate means that three of every 100 scheduled working hours were lost. Whether that is concerning depends on the employer’s previous results, industry, staffing model, absence definition, and operational impact.
A consistent increase from 1.5% to 3% may deserve investigation even when another organization considers 3% normal.
Does PTO count as absenteeism?
Approved vacation and planned PTO are normally excluded from an unplanned absenteeism rate because the employer knew about the absence in advance.
PTO may be included in a broader workforce-availability report that measures all unavailable scheduled time. The BLS excludes vacation, personal days, and holidays from its published absence measure.
Should sick leave be included in the absence rate?
Sick leave should be included when calculating a sickness absence rate or a broader total absence rate. It may also be included in an unplanned absenteeism rate when the sickness absence was not scheduled in advance.
The report should clearly state whether it includes all sickness leave, only unplanned sickness, or both short- and long-term medical absences.
How do you calculate a monthly employee absence rate?
Add all absent scheduled hours recorded during the month. Divide that number by the total hours the same employees were scheduled to work during that month, then multiply by 100.
For example:
120 absent hours ÷ 6,000 scheduled hours × 100 = 2%
Adjust scheduled hours for new hires, departing employees, public holidays, part-time schedules, and mid-month schedule changes.
How do you calculate the absence rate for part-time employees?
Use the part-time employee’s actual scheduled hours rather than a standard full-time schedule.
For example, if an employee was scheduled for 80 hours during the month and missed six hours:
6 ÷ 80 × 100 = 7.5%
How do you calculate an absence rate for a team?
Add the absent hours for every employee in the team. Divide that total by the team’s combined scheduled hours and multiply by 100.
Do not simply average each employee’s percentage when team members work different numbers of hours. Dividing total absent hours by total scheduled hours produces a properly weighted team rate.
What is the difference between absence rate and attendance rate?
The absence rate measures the percentage of scheduled working time missed. The attendance rate measures the percentage of scheduled time attended or worked.
When both metrics use exactly the same time and definitions:
Attendance rate = 100% − Absence rate
For example, a 3% absence rate would produce a 97% attendance rate.
What is the difference between absence rate and lost-worktime rate?
An internal hours-based absence rate and a lost-worktime rate may use similar calculations. However, published sources can define the terms differently.
The BLS absence rate measures the percentage of full-time workers who experienced an absence. Its lost-worktime rate measures absent hours as a percentage of hours usually worked.
How many absence days equal a 1% annual absence rate?
For an employee scheduled to work 260 equal-length days per year, a 1% absence rate represents approximately 2.6 workdays.
The precise number depends on the employee’s actual annual schedule. Using hours provides a more accurate result when shift lengths vary.
Conclusion
The employee absence rate measures how much scheduled working time was lost during a defined period. For most organizations, the most accurate method is to divide absent working hours by scheduled working hours and multiply the result by 100.
The percentage becomes useful only when the company clearly defines the absence categories, uses real work schedules, and applies the same calculation consistently. External benchmarks can provide context, but internal trends and operational impact are often more meaningful.
By reviewing absence rate alongside frequency, duration, schedules, reasons, and protected-leave status, employers can make better staffing decisions without treating every absence as a performance problem.